On July 13th, the U.S. Bureau of Labor Statistics (BLS) reported that the Consumer Price Index for All Urban Consumers (inflation) increased 1.3% in June after rising 1.0% in May. Over the last 12 months, the all items index increased 9.1%.
Worse:
- The all items index increased 9.1% for the 12 months ending June, the largest 12-month increase since the period ending November 1981
- The all items less food and energy index rose 5.9% over the last 12 months
- The energy index rose 41.6% over the last year, the largest 12-month increase since the period ending April 1980
- The food index increased 10.4% for the 12-months ending June, the largest 12 month increase since the period ending February 1981
Inflation That Producers are Seeing
While the Consumer Price Index (CPI) received a lot of media attention, what didn’t get very much attention was when the Bureau of Labor Statistics released the Producer Price Index (PPI) just a couple of days later.
If you don’t know, the Producer Price Index is a family of indexes that measures the average change over time in prices received by domestic producers of goods and services. In other words, PPIs measure price changes from the perspective of sellers (versus CPI which measures from the perspective of consumers).
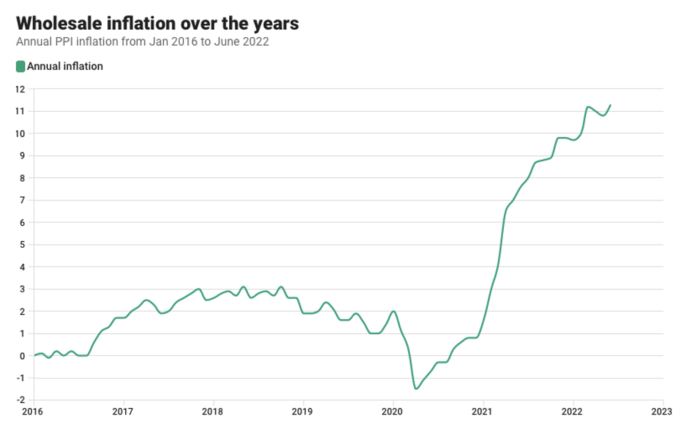
On July 15th, the BLS reported that the Producer Price Index jumped to 11.3% over the past 12 months, growing 1.1% in June alone (after rising 0.9% in May and 0.45 in April). It was the 6th consecutive month of increases.

It is true that most of June’s increase (90%) can be attributed to a 10.0% jump in prices for final demand energy, as gasoline prices leapt 18.5%. But remember, although the Producer Price Index measures the wholesale prices of goods and services, those increases are eventually passed down to consumers.
Investors Must Account for Inflation
Therefore, it is imperative that your long-term retirement strategies account for inflation and
that you prepare for a decrease in the purchasing power of your dollar over time. You should strongly consider assuming that inflation will be more than 3% – its historical average.
It’s true that inflation today hovers over 9% – more than quadruple the Federal Reserve’s target 2% inflation rate – but a better assumption might be one based on the last 100-years of data.
If you’re wrong and you find that the inflation rate for the next 25 years turns out to be 2%, then the purchasing power of your retirement savings will be more, not less.
Ready to start investing today?
Important Disclosures:
The opinions voiced in this material are for general information only and are not intended to provide specific advice or recommendations for any individual.
Past performance is no guarantee of future results.
The Consumer Price Index (CPI) is a measure of the average change over time in the prices paid by urban consumers for a market basket of consumer goods and services.
Producer Price Index (PPI) is an inflationary indicator published by the U.S. Bureau of Labor Statistics to evaluate wholesale price levels in the economy.
Inflation is the rate at which the general level of prices for goods and services is rising, and, subsequently, purchasing power is falling.
All information is believed to be from reliable sources; however LPL Financial makes no representation as to its completeness or accuracy.
This article was prepared by FMeX.
LPL Tracking #1-05305769


